
POLARIS: SUBMARKET UPDATE
- Colliers | Columbus

- Mar 11, 2021
- 2 min read
Written by: Hannah Williams, CPRC
Hannah specializes in research capabilities, providing support for the Colliers Columbus Office, Industrial, Retail, and Multifamily Groups. She is responsible for executing data reports, maintaining a commercial property database, reporting quarterly trends, performing data analysis and utilizing statistical information to predict future behavior in the market. She also assists the marketing and research director on special projects and corporate initiatives. Keep reading to get Hannah’s take on what’s happening in the Polaris submarket.

Submarket Stats
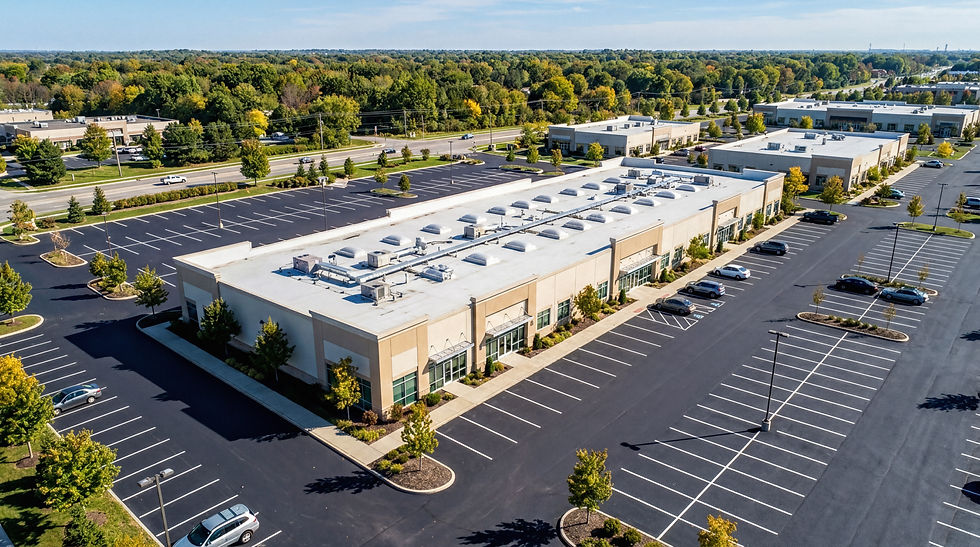
The Polaris office submarket had a strong fourth quarter, posting 42,271 square feet of net absorption – the highest net absorption of any submarket in Q4. Polaris also ended 2020 with year-to-date positive absorption, recording 47,533 square feet. The most significant activity in the submarket last quarter occurred when Bank of America occupied their 59,000-square-foot space at the newly completed Pointe at Polaris Phase II. This project’s remaining 26,000 square feet availability was added to the market this quarter, increasing the vacancy rate in the submarket to 8.61 percent. Polaris asking rates remained steady at $20.64 per square foot, with Class A asking rates at $21.01 per square foot. The submarket can anticipate consistent absorption moving forward, as three of the top ten largest leases from Q4 were signed in Polaris. Quest Business Centers, Matrix Engineering and Entourage Freight Solutions leased a combined 46,000 square feet and are all expected to occupy throughout 2021.
Tenants in the Market
Colliers | Columbus reports that 4 office tenants accounting for over 13,500 square feet are looking for space exclusively in the Polaris submarket. Additionally, 29 tenants accounting for over 910,000 square feet are looking for space in multiple markets including Polaris. The retail sector has 2 tenants currently looking in the Polaris submarket and 73 tenants looking in multiple markets including Polaris. On the industrial side, there are currently 21 tenants looking in the North submarket, which includes the Polaris area

By using a points system based on signed square feet from new leases, we are able to track where office users are coming and going throughout the city. Above is a heat map representing activity from all of 2020, with red representing positive movement and blue representing negative movement. The Polaris submarket had a strong year, with 8 tenants moving into the submarket, 6 tenants moving within the submarket and only 3 tenants moving out of the submarket. For the full heat map and points breakdown, check out our 2021 Columbus Office Tenant Report.

Comments