
CHART OF THE MONTH: HOW OFFICE VACANCY RATES HAVE SHIFTED OVER TWO YEARS
- Colliers | Columbus

- Oct 29, 2025
- 2 min read
Written by: Jake Lord
Jake specializes in research capabilities, providing support for the Colliers Columbus Office, Industrial, Retail and Capital Market groups. He is responsible for executing data reports, maintaining a commercial property database, reporting quarterly trends, performing data analysis, and utilizing statistical information to predict future behavior in the market. Keep reading for his take on office vacancy over the last two years.

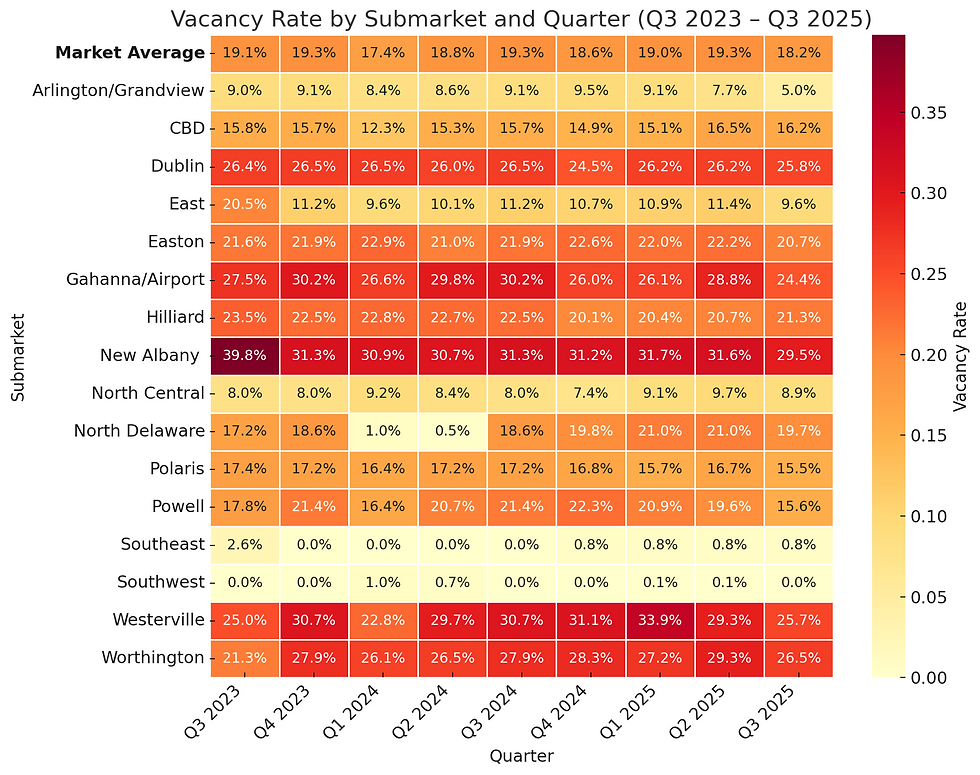
October’s Chart of the Month highlights how vacancy rates changed across Columbus office submarkets from Q3 2023 to Q3 2025. The heatmap shows vacancy rates by submarket and quarter, with darker colors indicating higher rates. The bar graph shows each submarket’s average vacancy rate, and both charts include the market average for comparison.
Observations
Suburban submarkets have seen higher vacancy than the urban submarkets (CBD and Arlington/Grandview), though this trend has recently moderated.
On average, vacancy rates have fallen throughout the Columbus market since Q3 2023 as absorption steadily increases, especially in suburban submarkets.
The market average vacancy rate is largely driven by high inventory submarkets like the CBD, as skyline buildings dominate in cumulative square footage.
Submarkets northeast of the CBD, including New Albany, Westerville, and Gahanna/Airport, have seen high average vacancy rates, particularly due to buildings that were recently and completely vacated by a single tenant.
Submarkets with very low inventory also have very low vacancy rates (e.g., Southeast).
Predictions
Strengthened tenant demand in suburban submarkets like Dublin and Westerville should modestly improve vacancy rates through the end of the year.
The Arlington/Grandview submarket vacancy rate should stabilize around 5-6% as tenants seek sparce Class A space in districts like Grandview Yard.
Through the end of 2025, The CBD submarket vacancy rate may stabilize at 15-16% due to high baseline inventory and plateaued tenant demand.
As direct asking rates modestly lower, vacancy rates may improve as tenant demand matches lowered price per square foot.
Overall, the Columbus office market shows strong fundamentals, such as modest vacancy improvements over the past two years, across numerous submarkets, well-positioning it for diverse growth and opportunities.


Comments