
CHART OF THE MONTH: TRACKING COLUMBUS RETAIL PROPERTY SALES OVER THREE YEARS
- Colliers | Columbus

- Nov 25, 2025
- 3 min read
Written by: Jake Lord
Jake specializes in research capabilities, providing support for the Colliers Columbus Office, Industrial, Retail and Capital Market groups. He is responsible for executing data reports, maintaining a commercial property database, reporting quarterly trends, performing data analysis, and utilizing statistical information to predict future behavior in the market. Keep reading for his insights on retail transaction volume and sales price per square foot in Columbus over the past three years.

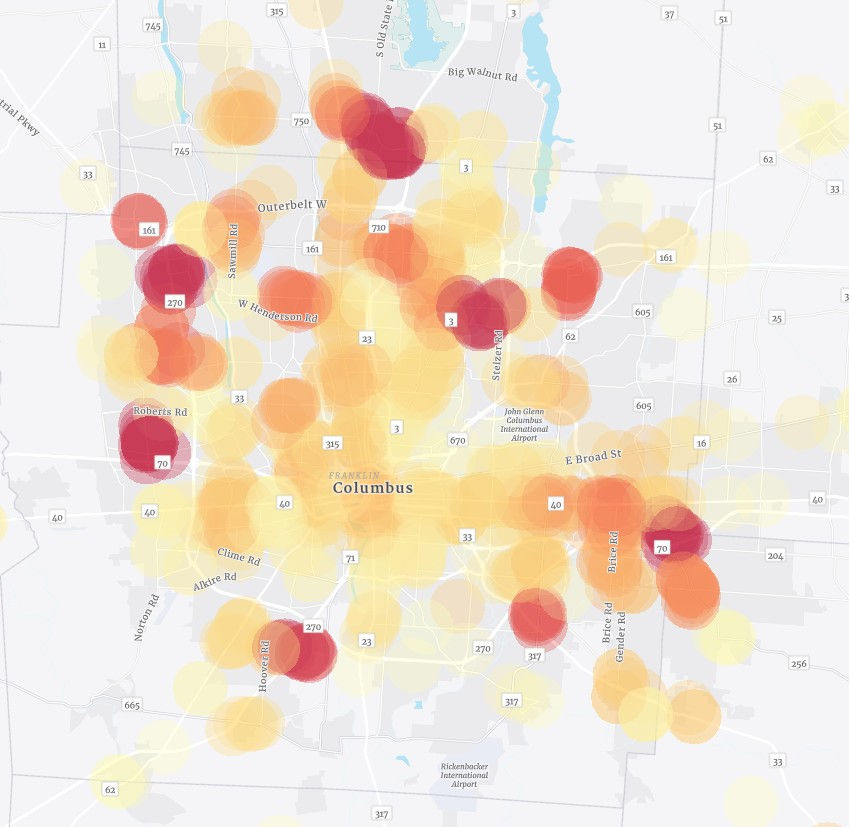
November’s Chart of the Month examines total retail property transaction volume and average sale price per square foot in the Columbus market from Q3 2022 to Q3 2025. The combo bar graph shows changes in transaction volume and average price per square foot throughout the period. The heatmap shows total transaction volume along with the number of executed sales by geography. The darker, red circles represent areas where higher price transactions occurred. In contrast, yellow circles represent lower-value transactions.
Observations
The bar graph reveals the sales price per square foot has steadily increased over the past two years, from $71 per square foot in Q3 2023 to $175 per square foot in Q3 2025, due to dropping vacancy rates and overall supply. There was a year-over-year decline in price per square foot from Q3 2022 to Q3 2023; however, prices have been steadily increasing since then. Conversely, total transaction volume has continued to decline since Q4 2024. Additionally, total sales have not exceeded $200 million since Q2 2024. During that quarter, a private investment firm acquired properties in Polaris and Easton, contributing more than $150 million in transaction volume. Overall, the Columbus retail market shows only a modest relationship between retail sales volume and price per square foot.
The heatmap shows that a greater number of transactions took place closer to the urban core, like the CBD, whereas the suburban shopping centers right off I-270 saw the highest value deals. Sixty-two transactions took place around downtown Columbus and the Short North, while the Grandview/Upper Arlington and Linden areas also saw a high number of transactions. The Polaris area saw substantial sales activity, including those of high and low value, with 48 transactions recorded along the busy Polaris Pkwy. Indeed, nearly $50 million in total property transactions were recorded in a one-mile radius of the Polaris shopping center. Tuttle Crossing, Easton, Hilliard Rome, Stringtown and Taylor Square shopping centers also totaled nearly $50 million in total transaction volume over the past three years. While this map focuses on property transactions, it also suggests where Columbus consumers spend the most.
Predictions
As visualized in the bar graph, we expect transactions volume and price per square foot to further stabilize into the new year, as transaction volume should stay above $100 million invested. This trend is in line with the stabilized 2.75% retail vacancy rate in Columbus. However, decreasing interest rates may lead to greater transaction activity as lending conditions ease. Volume should stay the same in Q4 2025, if not modestly increase, as price per square foot continues to moderate. The Columbus market will still see low vacancy rates as more mixed-use developments deliver, leading to low supply, further keeping per square foot price around the upper-$100s.
The location and count of transactions, as shown on the map, should stay the same as these retail patterns are core to the city’s business landscape. Consumer preferences for a modern shopping experience are evident with the popularity of Easton and Polaris. As Columbus’ economy expands as Intel and Anduril take footholds in the market, retail opportunities should also increase particularly near Groveport, Reynoldsburg and into Pickaway and Licking Counties. A competitive business environment in walkable areas like downtown’s Brewery District and Short North will also persist, fueling retail property transactions. Columbus remains poised to be a city where people can live, work and play.


Comments