
CHART OF THE MONTH: OWNER-USER VS. INVESTOR TRANSACTIONS IN THE COLUMBUS OFFICE MARKET
- Colliers | Columbus

- Dec 18, 2025
- 4 min read
Updated: Jan 27
Written by: Jake Lord
Jake specializes in research capabilities, providing support for the Colliers Columbus Office, Industrial, Retail and Capital Market groups. He is responsible for executing data reports, maintaining a commercial property database, reporting quarterly trends, performing data analysis, and utilizing statistical information to predict future behavior in the market. Keep reading for his insights on office property transactions between owner-users and investors over the last four years.
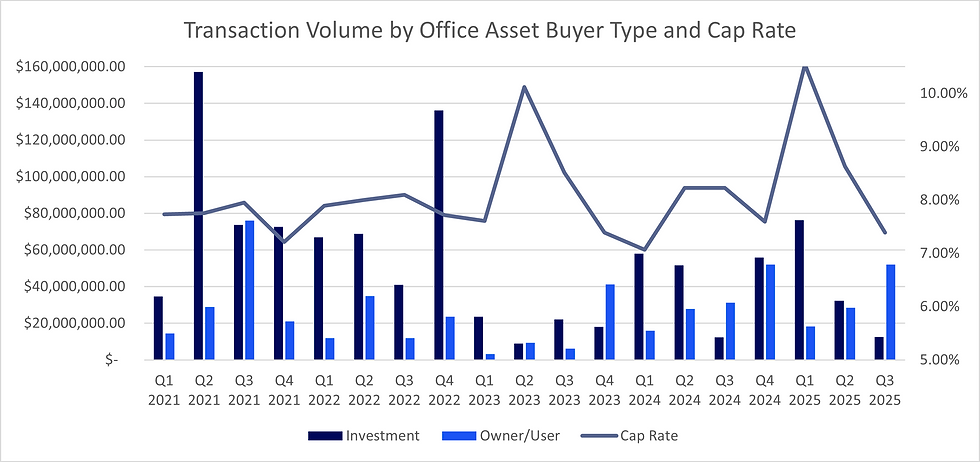
December’s Chart of the Month examines office property sales from Q1 2021 through Q3 2025, focusing on differences between owner-user and investment transactions across the Columbus office market. The graph illustrates transaction volume for both buyer types alongside prevailing cap rates over the past four years. The left axis displays transaction volume, while the right axis shows cap rate percentages.
It is important to note that cap rates are based on reported transactions only and are not disclosed for every sale, which can create greater quarter-to-quarter variability, particularly during lower-volume periods. As a result, quarterly cap rate figures should be viewed as directional indicators rather than precise market averages.
The accompanying density maps highlight where owner-users versus investors are deploying capital throughout the market, with gray representing investment activity and blue indicating owner-user activity.
Graph Analysis
Investment activity was exceptionally strong in 2021 and 2022, driven by excess liquidity, historically low interest rates, and other defining characteristics of the post-COVID office capital market. Although sellers faced limited pressure to transact, asset prices increased while borrowing costs declined, resulting in elevated transaction volumes. Furthermore, even though there was uncertainty about how and when employees would return to the office in 2021 and 2022, investors may have predicted that these challenges would be temporary rather than permanent. Buyers thus focused on the long-term value of office buildings and were able to lock in very low interest rates, which helped offset short-term concerns about space usage. With many investors competing for a limited number of available properties, pricing remained strong and cap rates stayed relatively stable despite broader economic uncertainty.
As interest rates rose, 2023 marked a clear trough in investment sales, as many major listings were withdrawn and financing conditions tightened. Cap rates increased as transaction volume declined, indicating that only a limited number of higher-risk deals were completed. Since Q1 2024, investment activity has returned to a more cyclical pattern, with stronger volumes observed in the early quarters of both 2024 and 2025. Despite a cap rate spike in Q2 2025, investment activity has generally stabilized, reflecting renewed price discovery in the office capital market.
In contrast, owner-user office transactions have remained more limited since 2021. Corporations and other owner-user buyers likely delayed real estate decisions during this period due to heightened operational uncertainty compared to investors. Owner-user transaction volume remained below $40 million for nearly two consecutive years and was similarly impacted by the 2023 market trough. Since 2024, however, owner-user activity has rebounded and stabilized as businesses adjusted to post-pandemic conditions and the return-to-office trend. Owner-user sales have since reached near parity with investment activity. Notably, owner-user transaction volume has continued to rise following the cap rate spike in Q1 2025, suggesting expanding opportunities for both buyers and sellers.


Map Analysis
The density maps illustrate how owner-users and investors allocate capital across the Columbus office market, with darker shading indicating higher transaction volumes by geography. The investment heatmap shows a strong concentration of activity in the Arlington/Grandview and CBD submarkets. From Q1 2021 through Q3 2025, these two areas accounted for more than $442 million in investment transactions, representing nearly half of total investment capital during this period. This concentration was largely driven by changes in ownership of downtown skyline buildings, as well as the major investment acquisition of the CoverMyMeds office property in the Franklinton neighborhood. The East submarket also experienced significant investment volume, primarily due to medical office transactions. Overall, investors have focused heavily on submarkets near the CBD, while still maintaining activity in established office corridors.
Owner-user capital, by comparison, is more geographically dispersed. Arlington/Grandview again recorded the highest transaction volume, largely driven by The Ohio State University’s $42 million purchase of The James medical office property in 2021. Other key owner-user submarkets included New Albany and Gahanna/Airport, which together accounted for more than $85 million in transactions, largely influenced by the recent EOG Resources office campus acquisition. Both investment and owner-user activity were also strong in the Westerville and Dublin submarkets, reinforcing these areas as active office corridors. Overall, investment transaction volume nearly doubled owner-user volume during this timeframe, with approximately $987 million versus $460 million transacted, resulting in more than $1.5 billion in total office sales over the four-year period.
Predictions
Although investment activity has slowed since the post-pandemic peak and was notably affected by the 2023 trough, it is positioned to increase as more properties come to market under more favorable lending conditions. Compared to recent quarters, stronger office capital market activity is expected heading into Q1 2026. While the trajectory of cap rates in the evolving interest rate environment remains uncertain, Arlington/Grandview and CBD are likely to continue serving as focal points for investment activity unless more compelling opportunities emerge in suburban locations.
Based on recent trends, owner-user activity is expected to continue rising through Q4 2025 before potentially leveling off early in the new year. However, continued economic and population growth in the Columbus region should attract additional owner-users seeking permanent real estate solutions aligned with return-to-work strategies.
Columbus remains an attractive destination for relocating firms, and owner-users are likely to continue pursuing best-fit properties across the market, with a preference for suburban locations offering greater parking availability and larger floor plates. Overall, the Columbus office market remains well positioned for both local and national investment while offering substantial opportunities for prospective owner-users.
Data sourced from CoStar


Comments